Part 1: The Basics of Economics
Section 1: What is Economics?
1.1 Defining Economics: The Study of Scarcity and Choice
Let’s start with the most basic question: What is Economics?
Think about it this way. As human beings, our wants are unlimited. We want a good phone, a nice house, a car, fancy clothes, holidays, and so on. The list never ends.
However, the resources to get these things are limited. Resources mean things like money, time, land, raw materials (like wood or iron), and people to do the work (labour). Because these resources are limited, we face a problem called scarcity.
Scarcity is the basic problem of life and economics. It simply means that we don’t have enough of everything to satisfy everyone’s wants.
Because of scarcity, we are forced to make choices.
- Example: Imagine you have ₹100. You want to watch a movie (which costs ₹100) and also buy a book (which costs ₹100). You cannot do both because your resource (money) is limited to ₹100. You have to choose one: either the movie or the book.
Economics is the study of how people make these choices. It studies how we (as individuals), how families, companies, and even the government use our limited resources to satisfy our unlimited wants in the best possible way.
So, in simple words, Economics is the science of making choices when there is scarcity. It deals with three main activities:
- Production: How goods are made (e.g., how a factory builds a car).
- Distribution: How these goods reach the people (e.g., how the car gets from the factory to a showroom near your house).
- Consumption: How people use these goods (e.g., you buying and driving the car).
1.2 The Two Main Branches: Microeconomics and Macroeconomics
Economics is a very big subject, so to make it easier to study, we divide it into two main parts: Microeconomics and Macroeconomics.
Think of them as two different ways of looking at the same thing. They are deeply connected and work together.
Let’s use an analogy: Imagine a huge forest.
- Microeconomics is like studying a single tree in that forest. You look at its leaves, its branches, its roots, and the insects living on it. You are focusing on one individual unit.
- Macroeconomics is like climbing a mountain and looking at the entire forest. You are not looking at individual trees. Instead, you are looking at the health of the whole forest, whether it is growing or shrinking, and the overall climate affecting it.
Now, let’s look at them in more detail.
1.2.1 Microeconomics: Looking at the Small Picture (Bottom-Up View)
What it is: Microeconomics studies the economic decisions and behaviour of individual units. This means it looks at:
- An individual person or a single family (a household).
- A single company or a firm.
- A specific market (like the market for smartphones in India).
It’s a “bottom-up” view because it starts with the smallest parts and builds up. It tries to understand how these small units make decisions. For example, why do you decide to buy a Samsung phone instead of an Apple phone? Or, how does a company like Tata Motors decide the price of its cars?
Key Ideas in Microeconomics:
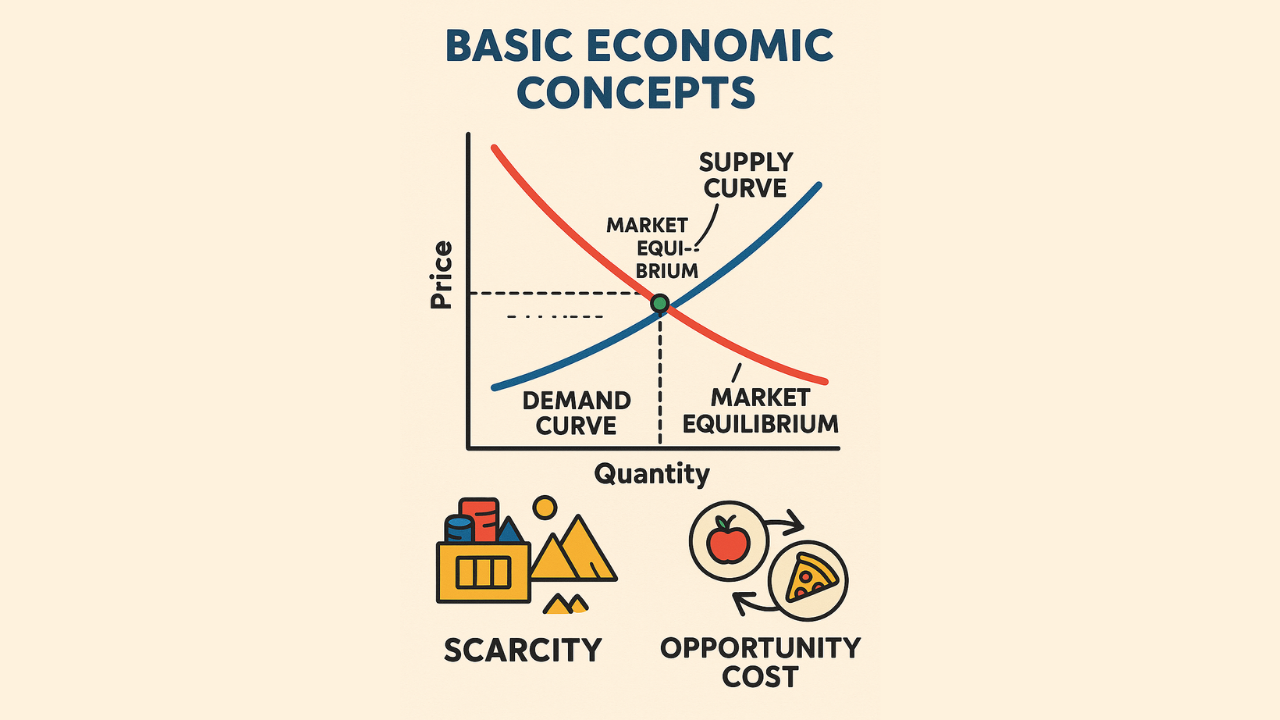
- Demand, Supply, and Equilibrium: This is the most important idea in microeconomics.
- Demand: How much of a product people are willing to buy at a certain price. (If mangoes are cheap, demand is high. If they are very expensive, demand is low).
- Supply: How much of a product sellers are willing to sell at a certain price. (If the price of mangoes is high, farmers will want to sell more).
- Equilibrium: This is the “sweet spot” or the balance point. It’s the price where the amount buyers want to buy is exactly equal to the amount sellers want to sell. This is how prices are decided in a market.
- Production Theory: This studies how companies turn inputs (like steel, plastic, and workers) into outputs (like a finished car). It looks at how they can do this in the most efficient and cheapest way.
- Costs of Production: This idea says that the price of any product is decided by how much money was spent to make it. A company needs to know its costs to set the right price and make a profit.
- Labor Economics: This focuses only on the job market. It looks at how salaries (wages) are decided, why some people are unemployed, and the relationship between workers and employers.
Why is this important for UPSC?
As a civil servant, you will be making policies that affect individual people and businesses. Microeconomics helps you understand the real-world impact of these policies.
- Example 1: The government sets a Minimum Support Price (MSP) for wheat. Using microeconomics, you can understand how this will affect a single farmer’s income, the price of bread for a consumer, and whether it will lead to food price inflation.
- Example 2: The government puts a new tax on cigarettes. Microeconomics helps you predict how this will change the behaviour of individual smokers and the business of cigarette companies.
1.2.2 Macroeconomics: Looking at the Big Picture (Top-Down View)
What it is: Macroeconomics studies the economy as a whole. It doesn’t care about one person or one company. It looks at the big picture for the entire country or even the world.
It is a “top-down” view. It asks big questions like:
- Is the Indian economy growing or slowing down?
- Why are prices of everything rising in the country (inflation)?
- Why are so many people unemployed?
- How can we reduce poverty in the whole country?
It deals with big, national issues and uses “aggregate” data, which means total data. For example, it looks at:
- Gross Domestic Product (GDP): The total value of all goods and services produced in a country in a year.
- National Income: The total income of everyone in the country.
- Inflation: The rate at which the general level of prices is rising.
- Unemployment: The number of people who want to work but don’t have jobs.
Who started it and what are its tools?
A famous economist, John Maynard Keynes, is known as the father of modern macroeconomics. He argued that during bad times like the Great Depression of the 1930s, the government must step in and spend money to manage the economy.
The main tools of macroeconomics are:
- Aggregate Demand: The total demand for all goods and services from all people in the entire country.
- Aggregate Supply: The total supply of all goods and services from all producers in the entire country.
Why is this important for UPSC?
Macroeconomics is extremely important for the UPSC exam, especially for General Studies Paper 3. This is the language spoken by the government and the Reserve Bank of India (RBI).
- Understanding macroeconomics helps you understand the Union Budget. Why is the government spending more on roads? Why are taxes being increased or decreased?
- It helps you understand the RBI’s monetary policy. Why did the RBI increase interest rates? How does this control inflation?
- It helps you understand the logic behind big government schemes aimed at increasing economic growth and creating jobs.
1.2.3 How Micro and Macro are Connected
Although they look at things differently, micro and macroeconomics are not separate. They are two sides of the same coin and are deeply connected.
The big picture (macro) is made up of many small pictures (micro).
- For example, the overall inflation rate in India (a macro issue) is just the average of the price changes of millions of individual products like dal, petrol, soap, and mobile recharges (micro things).
- Similarly, the total savings of India (a macro number) is simply the sum of the savings of every single household and company in the country (micro units).
This connection is very important for policy-making.
A big government policy (macro) will only work if it successfully influences the decisions of small, individual players (micro).
- Example: The government launched the Production Linked Incentive (PLI) scheme. This is a big macro policy to boost manufacturing in India. The goal is to increase India’s GDP and exports (macro goals).
- However, this scheme will only succeed if an individual company (micro unit) decides that the government’s incentive is good enough for it to invest crores of rupees in a new factory. The success of the big macro policy depends entirely on millions of such individual micro decisions.
Similarly, big macro problems often start from small micro issues.
- Example: High food inflation in India (a macro problem) is often caused by micro problems. For instance, if heavy rains destroy the onion crop in Maharashtra (a micro event), the supply of onions across the country will fall, and its price will shoot up, contributing to the overall macro inflation.
For a civil servant, this means you need a ‘dual-lens’ approach. You need to be able to zoom in to see the individual tree (micro) and also zoom out to see the whole forest (macro) to understand any economic issue properly and create effective policies.
Section 2: The Main Problem in Economics
2.1 Scarcity: The Problem Everyone Faces
As we discussed before, the single most important idea in all of economics is scarcity.
Scarcity is the simple fact that we cannot have everything we want. Why? Because our wants for things (goods and services) are far greater than what can be produced with our limited resources. It’s the universal problem of having unlimited wants but living in a world of limited resources. This is the fundamental economic problem for every person, every family, and every country.
Needs vs. Wants 🤔
To understand scarcity better, let’s see the difference between needs and wants.
- Needs are things that are absolutely essential for you to survive. This includes basic food, clean water, and a place to live (shelter). Needs are limited; you can only eat so much food or live in one house at a time.
- Wants are all the other things you desire to make your life more comfortable, fun, or enjoyable. This could be a smartphone, a Netflix subscription, a car, or a holiday in Goa. Wants are infinite. As soon as you get one thing, you start wanting something else.
This endless cycle of wants is what creates the problem of scarcity when faced with our limited resources.
Are all goods scarce?
No, but most are. A good that is not scarce is called a free good. This is something you can use without stopping someone else from using it. The best example is gravity. Your use of gravity doesn’t reduce the amount of gravity available for others.
However, most things we think of as “free” are actually scarce. Let’s take air. It seems free and abundant, right? But air has alternative uses. We need it to breathe clean, healthy air. But factories and cars use it as a place to dump their pollution. So, we have a choice: should we use the air for breathing or for dumping waste? The more we pollute (one choice), the less healthy the air is to breathe (giving up the other choice). Because we have to make a choice or a trade-off, even air is considered a scarce good in economics.
2.2 The Three Central Questions of an Economy
The reality of scarcity forces every single society—whether it’s India, the USA, or a small village—to answer three basic and very important questions.
- What to produce? 🧐 Since we can’t produce everything, we must decide what things to make and in how much quantity. Our resources are limited. If the government decides to use steel and money to build more tanks and military weapons, it means there will be less steel and money available to build new schools or hospitals. A society has to make a choice.
- How to produce? ⚙️ After deciding what to make, a society must decide the method of production. For example, should we make clothes using many workers (this is called labour-intensive production) or by using big, expensive machines (called capital-intensive production)? Should we build water pipes using copper or plastic? The goal is to choose the most efficient method that uses our scarce resources in the best possible way.
- For whom to produce? 👨👩👧👦 Once the goods and services are made, how do we distribute them among the people? Who gets what? Should the person who can pay the most get the product? Or should it be given based on who needs it the most? For example, during the COVID-19 pandemic, should the limited supply of vaccines go to the rich first, or to the elderly and frontline workers? This question is all about sharing the country’s total output and deals with big ideas like fairness, equality, and justice.
2.3 Factors of Production
The scarce resources that are used to make all goods and services are called Factors of Production. Think of them as the basic ingredients of an economy. There are four main types:
- Land 🏞️ This doesn’t just mean the physical ground. In economics, ‘Land’ includes all natural resources. This means things like minerals (iron ore, coal), forests, rivers, oil, and sunshine. A country’s economy is often shaped by the natural resources it has.
- Labour 💪 This is the human effort—both physical and mental—that goes into producing something. It’s the work done by a farmer in the field, an engineer designing a bridge, or a teacher in a classroom. The quality of labour is very important. When workers are well-educated, skilled, and healthy, we call it good human capital. A country with good human capital can produce more things more efficiently.
- Capital 🏭 This is a tricky one. In everyday language, we think of capital as money. But in economics, Capital means man-made goods that are used to produce other goods. It refers to physical assets like machinery, tools, factories, computers, roads, and bridges. Money itself doesn’t produce anything; you can’t build a chair with a ₹500 note. But you can use money to buy a machine (which is a capital good) that can then be used to produce thousands of chairs.
- Enterprise (or Entrepreneurship) 💡 This is the special human skill that brings the other three factors (land, labour, capital) together to produce something. The person who does this is called an entrepreneur. An entrepreneur is a risk-taker who has a business idea, organises the resources, and makes all the important decisions. People like Ratan Tata, or even a local person who starts a small shop, are entrepreneurs. If their business is successful, their reward is profit.
2.4 Opportunity Cost: The Real Cost of Every Choice
This is one of the most important concepts in economics. Because scarcity forces us to choose, every choice we make has a hidden cost.
Definition: Opportunity Cost is the value of the next-best alternative that you have to give up when you make a choice. It’s not the value of all the things you gave up, just the single best one.
There is a great saying: “Choosing is refusing.” When you choose one thing, you are refusing the benefit of the next best thing.
Let’s look at some simple examples:
- Individual Level: Suppose you have a free evening. You can either watch a movie or study for your exam. You choose to watch the movie. The opportunity cost of watching the movie is the studying you gave up.
- College Example: A student decides to study for a 4-year engineering degree. The cost is not just the college fees (say, ₹8 lakhs). The bigger, hidden cost is the salary she could have earned by working a job for those four years (say, ₹12 lakhs). This lost income of ₹12 lakhs is the opportunity cost of her degree.
- Business Level: A farmer has a piece of land. He can either plant wheat or corn. He chooses to plant wheat. The opportunity cost of planting wheat is the profit he could have earned from planting corn.
- Government Level: A city has a budget of ₹1 crore. It can either repair 1 km of road OR build 2 km of new bicycle paths. If the government chooses to repair the road, the opportunity cost is not ₹1 crore. The real opportunity cost is the 2 km of bicycle paths that could not be built.
Why this is SUPER IMPORTANT for UPSC
The Union Budget of India is the biggest example of managing opportunity costs.
- Recently, the government has decided to spend a huge amount of money on Capital Expenditure (Capex)—this means building long-term assets like highways, railways, and ports. This is great for the country’s future growth.
- But here’s the trade-off. The money used for building a highway is money that cannot be used for something else right now. This “something else” is the opportunity cost.
- What is the opportunity cost of building a new expressway? It is the benefit we give up from not spending that money on other things, such as:
- Hiring more doctors and teachers.
- Giving more money to schemes for child nutrition.
- Providing higher subsidies to poor farmers.
When you write an answer in the UPSC Mains exam, using the concept of opportunity cost makes your answer much more analytical and intelligent. Instead of just listing the pros and cons of a government policy, you can say:
“While the government’s focus on capital expenditure is beneficial for long-term growth, it comes with a significant opportunity cost. The marginal benefit of building one more kilometre of road must be carefully weighed against the marginal opportunity cost of not being able to fund, for example, a certain number of new primary health centres in villages.”
This shows the examiner that you understand the deep economic trade-offs that the government has to make.
Section 3: How Markets Work: Demand, Supply, and Balance
The meeting place for buyers and sellers is a market. It could be your local vegetable market or the Indian stock market. The prices of things in any market are decided by two powerful forces: Demand and Supply. Understanding these two is key to understanding a market economy.
3.1 The Law of Demand
This law explains the behaviour of buyers (consumers).
What it is: The Law of Demand is a very simple idea. It says that if all other things remain the same, when the price of a good goes up 🔼, people will want to buy less of it 🔽. And, when the price of a good goes down 🔽, people will want to buy more of it 🔼.
This is an inverse relationship (they move in opposite directions). Why does this happen? Because our money is limited. If the price of onions shoots up to ₹100 per kg, our purchasing power is reduced, and we are forced to buy less. If the price drops to ₹20 per kg, we might buy more.
For demand to be real (effective demand), you must have both the desire to buy something and the ability (money) to pay for it.
The Demand Curve
A demand curve is just a picture (a graph) of this law. It’s a line that slopes downwards from left to right, showing that as the price falls, the quantity people demand increases.
What causes demand to change?
A change in the price of a product makes us move up or down along the same demand curve. But sometimes, people start wanting more or less of a product even if the price hasn’t changed. This causes the entire demand curve to shift to the left (demand decreases) or to the right (demand increases). The reasons for this shift are called the determinants of demand.
Here are the main ones:
- Income of Consumers:
- Normal Goods: For most things, when your income increases, you demand more of them. If you get a promotion, you might buy more branded clothes. These are normal goods.
- Inferior Goods: For some things, when your income increases, you demand less. If you get richer, you might stop travelling by city bus and buy a bike instead. Here, bus travel is an inferior good.
- Prices of Related Goods:
- Substitutes: These are goods you can use in place of each other, like tea and coffee. If the price of coffee suddenly becomes very high, many people will switch to drinking tea. So, a price increase for coffee leads to an increase in demand for tea.
- Complements: These are goods that are used together, like a car and petrol. If the price of petrol goes up a lot, people might decide not to buy a car. So, a price increase for petrol leads to a decrease in demand for cars.
- Tastes and Preferences: Demand changes with fashion, trends, and health awareness. If a famous cricketer advertises a health drink, its demand might suddenly increase.
- Consumer Expectations: If you expect the price of something to rise in the future, you will buy more of it now. If you hear that smartphone prices will increase next month because of a new tax, you might rush to buy one today.
- Size of Population: More people means more demand. As a city’s population grows, the demand for houses, food, and water naturally increases.
Exception to the Law: Giffen Goods
In very rare cases, the law of demand doesn’t work. This happens with Giffen goods. A Giffen good is a very basic, low-quality food (like a coarse grain like bajra for a very poor family) that makes up a large part of their diet.
- Example: Imagine a poor labourer eats only bajra and a little bit of dal every day. If the price of bajra increases, he becomes even poorer. He can no longer afford to buy even that small amount of dal. To avoid starving, he is forced to stop buying dal and use that money to buy more bajra to fill his stomach.
- Here, an increase in price led to an increase in demand. This is a very rare exception.
3.2 The Law of Supply
This law explains the behaviour of sellers (producers).
What it is: The Law of Supply is the opposite of the law of demand. It says that when the price of a good goes up 🔼, producers will want to sell more of it 🔼. And, when the price of a good goes down 🔽, producers will want to sell less of it 🔽.
This is a direct relationship (they move in the same direction). Why? Because producers are in business to make a profit. Higher prices mean higher potential profits, which gives them a bigger incentive to produce and sell more.
The Supply Curve
The supply curve is a graph that shows this relationship. It’s a line that slopes upwards from left to right, showing that producers are willing to supply more at higher prices.
What causes supply to change?
Just like with demand, factors other than the price can cause the entire supply curve to shift. These are the determinants of supply.
- Price of Resources (Input Costs): If the cost of raw materials goes up, production becomes more expensive and less profitable. For example, if the price of cotton increases, a T-shirt company will produce fewer T-shirts. This decreases supply.
- Technological Advancements: A new machine that can produce goods faster or cheaper will increase supply. For example, a new printing press that uses less ink and paper will encourage a publisher to supply more books.
- Taxes and Subsidies: If the government puts a high tax on producing a good, it increases the cost and reduces supply. If the government gives a subsidy (a financial help), it lowers the cost and increases supply. For example, a subsidy on solar panels encourages companies to produce more of them.
- Number of Firms: If more companies enter a market, the total supply will increase.
3.3 Market Equilibrium
This is the point where the two forces of demand and supply meet and balance each other.
What it is: Equilibrium is the situation where the price has reached a level where the quantity demanded is exactly equal to the quantity supplied. This price is called the equilibrium price or the market-clearing price.
At this point, every buyer who wants to buy at that price finds a seller, and every seller who wants to sell at that price finds a buyer. There is no shortage and no surplus. The market is in balance.
How Equilibrium Changes
The market equilibrium can change. If any of the “determinants” we discussed earlier changes, one of the curves will shift, and a new equilibrium point will be created.
- Example: Suppose a report comes out saying mangoes are very good for health. This will increase the demand for mangoes (the demand curve shifts to the right). At the old price, there will now be a shortage of mangoes. This shortage will push the price up until a new, higher equilibrium price is reached, where demand once again equals supply.
3.4 Elasticity: Measuring Sensitivity
Elasticity is a very important concept that measures how sensitive one thing is to a change in another. It basically asks the question: “If I change X by a little bit, how much will Y change?”
Price Elasticity of Demand (PED)
This is the most common type. It measures how much the quantity demanded changes when the price changes.
- Elastic Demand (Sensitive): Here, a small change in price leads to a big change in demand. This is common for luxury goods or goods with many substitutes. For example, if the price of a specific brand of chocolate goes up by 10%, people might easily switch to another brand, causing demand for the first brand to fall by 30%.
- Inelastic Demand (Not Sensitive): Here, even a big change in price causes only a small change in demand. This is true for necessities like salt, life-saving medicines, or petrol. If the price of petrol goes up by 20%, you might try to drive a little less, but you still need it, so your demand might fall by only 5%.
Other Types of Elasticity
- Income Elasticity: Measures how demand changes when your income changes. It tells us if a good is a normal good or an inferior good.
- Cross Elasticity: Measures how the demand for Good A changes when the price of Good B changes. It tells us if goods are substitutes (positive elasticity) or complements (negative elasticity).
Why is Elasticity SUPER IMPORTANT for UPSC?
The government uses the concept of elasticity every day to make policies. It is the practical foundation for many decisions.
- Goods and Services Tax (GST): The GST structure is a perfect example of elasticity.
- Essentials like salt and unpackaged food have inelastic demand. People have to buy them no matter the price. Taxing them heavily would hurt the poor a lot. That’s why they are in the 0% or 5% GST slab.
- Luxury items like expensive cars or ‘sin’ goods like tobacco have more elastic demand. The government taxes them at the highest rate (28%). This helps raise more revenue from those who can afford it without hurting the poor.
- Minimum Support Price (MSP): When the government sets an MSP for a crop like wheat, it is setting a price floor. The financial cost of this policy (how much surplus grain the government has to buy) depends heavily on the elasticity of demand and supply for wheat. If demand is very inelastic, consumers will keep buying even at a higher price, and the government’s burden will be less.
Section 4: Market Structures and Competition
First, what is a market structure? In simple words, it’s just a way to classify or categorise different industries based on how much competition exists in them.
The structure of a market is very important because it affects how companies in that market behave. It decides things like: How do they set prices? How much do they produce? How much profit can they make?
We can classify any market by looking at a few key things:
- How many buyers and sellers are there?
- Are the products sold by different companies identical or are they different from each other?
- Is it easy or difficult for a new company to enter that market? (We call this barriers to entry).
Markets can range from having intense competition to having no competition at all. Let’s look at the main types.
4.1 Perfect Competition
Think of this as an ideal, “perfect” situation which is used as a benchmark in economics. It’s rare to find it in the real world in its pure form.
What are its features? 🌟
- Many Buyers and Sellers: There are thousands of sellers and thousands of buyers. Because there are so many, no single person or company is big enough to influence the price.
- Homogeneous Product: “Homogeneous” means identical. All companies sell the exact same product. There is no difference in quality, size, or branding.
- Free Entry and Exit: It is very easy for a new company to start selling in this market, and it’s also very easy for an existing company to leave. There are no major hurdles like needing a big investment or a special government license.
- Perfect Information: All buyers and sellers know everything. They know all the prices being charged and the quality of the product.
- Price Takers: Because of all the above reasons, individual companies have zero control over the price. They have to accept the market price that is decided by the total demand and supply. They are “price takers,” not price makers.
What is the result?
This is the best-case scenario for consumers. Competition is so intense that prices are pushed down to the lowest possible level, and companies are forced to be super-efficient. In the long run, companies in this market only make “normal profits”—just enough money to stay in business, but not huge excess profits.
Examples in India: While no market is truly “perfect,” some come close.
- A local vegetable mandi: Imagine a market where hundreds of farmers are selling the same type of potato. The potatoes are identical, and no single farmer can charge a higher price than the market rate.
- The stock market: Millions of people are buying and selling shares of a company like Reliance. The shares are identical, and no single buyer or seller can control the share price.
4.2 Monopoly
This is the exact opposite of perfect competition. “Mono” means single.
What are its features? 👑
- Single Seller: There is only one company that produces and sells the entire product.
- No Close Substitutes: Consumers have no other good alternative to buy. If you don’t buy from the monopolist, you don’t get the product at all.
- High Barriers to Entry: It is extremely difficult or impossible for other companies to enter the market. This could be because:
- The startup cost is too high (e.g., building a whole railway network).
- The company owns a patent or special technology.
- The government has given an exclusive license to only one company.
- Price Maker: The monopolist has significant control over the price of the product. They can decide what price to charge.
What is the result?
A monopoly is generally bad for consumers. Without any competition, the monopolist will usually produce less quantity and sell it at a higher price to maximise its profit. This reduces consumer welfare. Also, with no competition, there is very little pressure on the company to innovate or improve its quality.
Examples in India:
- Indian Railways: For its network operations (the tracks, signals etc.), it is a monopoly. You cannot choose to travel on another company’s railway tracks in India.
- Natural Monopolies: In some sectors, it is most efficient for only one firm to operate because the initial setup costs are massive. For example, it would be wasteful for three different companies to lay their own separate water pipelines to your house. So, local water supply and electricity distribution grids are often natural monopolies.
4.3 Monopolistic Competition
This is a very realistic and common market structure that is a mix of both monopoly and competition.
What are its features? 🛍️
- Large Number of Firms: There are many companies competing with each other.
- Product Differentiation: This is the most important feature. All companies sell products that are similar but not identical. They try to make their product seem different from their competitors. This difference can be created through:
- Branding (e.g., Nike vs. Adidas)
- Packaging
- Quality or Design
- Free Entry and Exit: It’s relatively easy for new firms to enter the market.
- Non-Price Competition: Companies don’t just compete on price. They compete heavily through advertising, marketing, and building brand loyalty.
What is the result?
Because each company has a slightly different product (like a unique brand of soap), it has a small amount of monopoly power and some control over its price. However, because there are many other competitors, this power is limited. If they raise their price too much, customers will switch to another brand. Like perfect competition, firms here also only make normal profits in the long run. The best thing for consumers is the wide variety of choices.
Examples in India: This market structure is everywhere!
- Restaurants: Many restaurants, but each offers a different menu, ambiance, or brand.
- Clothing and Shoe brands: So many brands, each with its own style and identity.
- Salons, Hotels, and everyday FMCG products like soaps and toothpastes.
4.4 Oligopoly
“Oligo” means few. This is a market that is controlled by a few very large firms.
What are its features? 📲
- Few Dominant Firms: A small number of companies (e.g., 3 to 5) control the majority of the market.
- High Barriers to Entry: It is very difficult for new companies to enter due to high costs, technology, or patents.
- Mutual Interdependence: This is the most critical feature. It’s like a game of chess. Each company’s decision heavily depends on the actions and reactions of its rivals. Before changing its price, a company must think about how its competitors will react.
- Products: The products can be identical (like steel or cement) or differentiated (like cars or smartphones).
What is the result?
The behaviour of firms in an oligopoly can be complex. They might get into fierce price wars, which can be good for consumers. Or, they might try to avoid competition and engage in collusion—secretly agreeing to fix prices high. When they do this, they form a cartel, which is illegal and very harmful to consumers. This interdependence often leads to price rigidity, meaning prices don’t change very often.
- A special case of an oligopoly with only two firms is a Duopoly.
Examples in India:
- Telecommunications: Dominated by Jio, Airtel, and Vi.
- Automobile Industry: A few big players like Maruti Suzuki, Hyundai, Tata Motors, and Mahindra.
- Airlines, Cement, and Steel industries.
Why is this important for UPSC? (The CCI Connection)
These market structures are not just academic theories. They are the reason India has a law called the Competition Act of 2002 and a powerful regulator called the Competition Commission of India (CCI).
Think of the CCI as the referee of the market. Its job is to ensure fair competition, protect consumers, and stop companies from using unfair practices that come from these non-competitive market structures.
- When the CCI investigates cement companies for forming a cartel to fix high prices, it is directly tackling the problem of collusion in an oligopoly.
- When the CCI looks into a big e-commerce or tech company to see if it is abusing its powerful position, it is addressing the problem of abuse of dominance which is a feature of a monopoly.
So, understanding these market structures is essential to understand the work of the CCI and the logic behind India’s competition policies. The goal of the CCI is to push real-world markets to behave more like the efficient and consumer-friendly model of perfect competition.
Table 1: Comparative Analysis of Market Structures
| Feature | Perfect Competition | Monopolistic Competition | Oligopoly | Monopoly |
| Number of Firms | Very large | Many | Few | One |
| Type of Product | Homogeneous (Identical) | Differentiated | Homogeneous or Differentiated | Unique (No close substitutes) |
| Barriers to Entry | None / Very Low | Low | High | Very High / Blocked |
| Firm’s Control over Price | None (Price Taker) | Some | Considerable (Interdependent) | Significant (Price Maker) |
| Long-Run Profitability | Normal Profit Only | Normal Profit Only | Can be Supernormal Profit | Can be Supernormal Profit |
| Efficiency | High (Allocative & Productive) | Lower (Excess Capacity) | Varies (Often Inefficient) | Low (Allocative Inefficiency) |
| Real-World Indian Example | Agricultural Mandis, Stock Market | Restaurants, Clothing Brands | Telecom, Automobiles, Cement | Indian Railways (Operations) |
Part II: The Big Picture (Macroeconomics) and India
Section 5: Economic Systems and the Indian Model
First, what is an economic system? Think of it as a country’s “operating system.” It’s the set of rules and institutions that a country uses to answer the three big economic questions we discussed earlier:
- What to produce?
- How to produce it?
- For whom to produce it?
The economic system decides who owns the resources (like land and factories) and how they are used. Broadly, there are three main types of economic systems.
5.1 Capitalist (Market) Economy
In this system, the main player is the private individual or company. The government takes a backseat. Think of countries like the USA as examples.
What are its features? 💰
- Private Property: Individuals and private companies have the right to own property, like land, houses, and factories. It’s your personal asset.
- Profit Motive: The main reason for doing business is to earn a profit. This desire for profit is what drives innovation and production.
- Consumer Sovereignty: The consumer is the king. Companies will only produce what the consumers want to buy. If people start demanding more electric cars, companies will start producing more electric cars.
- Price Mechanism: Prices are not set by the government. They are decided freely in the market by the forces of demand and supply. These prices act as signals to producers about what to produce.
- Minimal Government Intervention: The government’s role is very limited. It acts like a referee—it protects people’s property rights and enforces contracts, but it doesn’t tell businesses what to do. This “hands-off” approach is called laissez-faire.
5.2 Socialist (Command) Economy
This system is the opposite of capitalism. Here, the main player is the government (the state). Think of the old Soviet Union or China in the past.
What are its features? 🏛️
- Public Ownership: The government owns and controls all the major resources and industries (factories, mines, banks) on behalf of the people. There is no private property in terms of production.
- Central Planning: Instead of the market, a central government authority (like a Planning Commission) makes all the economic decisions. It decides what will be produced, in what quantity, and who will get it.
- Social Welfare Objective: The main goal is not profit. The main goal is the welfare of the entire society and ensuring that wealth is distributed equally among all citizens.
- Absence of Competition: Since the state controls everything, there is little or no competition between different firms.
5.3 The Mixed Economy: The Middle Path
A mixed economy tries to take the good parts of both capitalism and socialism and put them together. It’s a middle path that tries to find a balance.
What is it? 🤝
A mixed economy is a system where both the private sector and the public (government) sector exist together and play important roles.
It tries to balance the efficiency and innovation of the market (from capitalism) with the goal of social welfare and equality (from socialism). The government allows people to own private property and run businesses, but it also steps in (intervenes) to regulate the economy, provide public services like education and healthcare, and help the poor.
Most countries in the world today, including India, the USA, and the UK, are mixed economies. The only difference is the “mix” – some have more capitalism, and some have more socialism.
5.4 The Indian Economy as a Mixed Economy: Our Journey
India has always been a mixed economy since 1947, but the “recipe” of our mix has changed dramatically over time.
Phase 1: After Independence (Before 1991) – The Government-led Model
After independence, India’s leaders were inspired by socialism. So, they chose a mixed economy where the government had the dominant role.
- Centralized Planning: India had a Planning Commission that created Five-Year Plans. These plans set goals for the economy and decided where resources should go.
- Dominant Public Sector: The government set up many Public Sector Undertakings (PSUs) and took control of the most important industries like steel, banking, and mining. These were called the “commanding heights” of the economy.
- Heavy Regulation (The “Licence Raj”): The private sector was heavily controlled. You needed a government license or permit for almost everything—to start a factory, to expand production, or to import goods. Our economy was also closed off from the rest of the world to protect our domestic industries (protectionism). This system led to slow growth, inefficiency, and a lot of corruption.
Phase 2: After 1991 – The Shift towards the Market
By 1991, India was facing a huge economic crisis. To solve this, the government introduced the famous LPG Reforms (Liberalisation, Privatisation, Globalisation). This was a massive turning point. India began to shift its “mix” away from socialism and more towards a market-oriented (capitalist) system.
- The “Licence Raj” was dismantled.
- The role of the public sector was reduced, and many areas were opened up for private companies.
- The economy was opened to foreign trade and investment.
How India’s Mixed Economy Looks Today 🇮🇳
Today, India’s mixed economy has the following features:
- Coexistence of Public and Private Sectors: We have government-owned companies in key areas like Defence and Railways. But the private sector is now the main engine of our economic growth, leading in areas like IT, services, and manufacturing.
- Changed Role of Planning: The old Planning Commission has been replaced by NITI Aayog. NITI Aayog is not a central planner; it acts more like a “think tank” or an advisor to the government.
- Balance of Freedom and Control: Private companies have a lot of freedom. But the government still regulates important sectors like banking and telecom. It also provides a social safety net for the poor through schemes like the PDS (ration shops) and MGNREGA (job guarantee scheme).
- Focus on Citizen Welfare: The goal of social welfare is still very strong. We see this in the government’s many schemes for the poor, like Ayushman Bharat (health insurance), PMAY (housing for all), and PM-KISAN (income support for farmers).
Why this is SUPER IMPORTANT for UPSC
This evolution of India’s mixed economy is the key to understanding almost every major economic debate today. When you read about issues like:
- The government selling its stake in PSUs (disinvestment)
- The new laws for agricultural markets
- The new labour codes
…all these are fundamentally debates about the right “mix” between the government (state) and the private sector (market).
When writing a UPSC Mains answer, a top-quality response must analyse this tension.
- Example: Disinvestment of a PSU.
- The pro-market argument: It will bring efficiency, competition, and unlock capital.
- The pro-state/welfare argument: It could lead to job losses, harm social equity, and give up control of a strategic national asset.
Your answer should show that you understand these trade-offs between the goal of economic efficiency and the goal of social welfare.
Section 6: Measuring the Economy: National Income Accounting
Think of National Income Accounting as the government’s system of bookkeeping. It’s like creating a “report card” for the entire country’s economy to see how well it’s performing. This is done every year or every quarter (three months).
This report card is very important for the government to make plans and policies. The most famous number on this report card is the Gross Domestic Product (GDP).
6.1 Core Concepts of National Income
Let’s understand the most important terms one by one.
Gross Domestic Product (GDP) 🇮🇳 This is the big one you hear about in the news all the time.
- Definition: GDP is the total money value of all final goods and services produced within the domestic territory of a country in a specific time period.
- What does “final” mean? It means we only count the value of the finished product, not the parts that went into making it. This is to avoid double-counting.
- Example: To make a car (final good), you need tyres, steel, and glass (intermediate goods). If the final car is sold for ₹5 lakhs, we just count ₹5 lakhs. We don’t separately add the value of the tyres (say, ₹20,000) because their cost is already included in the car’s price. If we did, we would be counting the tyres’ value twice!
- What does “within the domestic territory” mean? It means it’s about geography. Anything produced within India’s borders is counted in India’s GDP, no matter who owns the company.
- Example: A car made by a Korean company like Hyundai in its factory in Chennai is a part of India’s GDP. However, the profit earned by an Indian company like Tata Motors in its factory in the UK is not part of India’s GDP.
Gross National Product (GNP) 👩💼 This is slightly different from GDP. It’s about who is producing, not where they are producing.
- Definition: GNP is the total money value of all final goods and services produced by the nationals (citizens) of a country, regardless of where they are in the world.
- The formula to connect them is: GNP = GDP + NFIA
- What is NFIA? It stands for Net Factor Income from Abroad. In simple terms:
- NFIA = (Money earned by Indians working abroad) – (Money earned by foreigners working in India).
- For India: Historically, the money earned by foreigners working in India has been more than the money earned by Indians working abroad. So, India’s NFIA is negative. This means for India, GNP is usually lower than its GDP.
Net Domestic Product (NDP) and Net National Product (NNP) 🔧 The words “Gross” in GDP and GNP mean we haven’t accounted for something called depreciation.
- What is Depreciation? It’s the natural wear and tear of capital goods like machines, buildings, and roads over time. A machine in a factory gets old and loses value every year. This loss in value is depreciation.
- The word “Net” simply means after subtracting depreciation.
- NDP = GDP – Depreciation
- NNP = GNP – Depreciation
- “Net” figures are considered a more accurate measure of a country’s real income because they show what’s left after accounting for the maintenance of our assets.
- Very Important Point: The NNP at Factor Cost is generally what is called the National Income of a country.
6.2 Factor Cost vs. Market Price
The value of a product can be looked at in two ways:
- Market Price (MP): This is the actual price you and I pay for a product in a shop. This price includes indirect taxes (like GST) that the government adds, and it is reduced by any subsidies the government gives.
- Example: If a bottle of soft drink costs ₹18 from the factory, the government might add ₹2 as GST. So, the market price you pay is ₹20.
- Factor Cost (FC): This is the price of the product from the producer’s point of view. It is the cost of all the “factors of production” used to make it (rent for land, wages for labour, profit for the entrepreneur). It does not include the tax paid to the government. In the above example, the factor cost is ₹18.
The relationship is: Market Price = Factor Cost + Indirect Taxes – Subsidies
6.3 Real vs. Nominal GDP
This is a very important concept to understand true economic growth.
- Nominal GDP: This is the GDP calculated using the prices of the current year. Nominal GDP can go up for two reasons: (1) we actually produced more goods and services, OR (2) the prices of everything went up (inflation). So, it can be misleading.
- Real GDP: This is the GDP calculated using the prices of a fixed base year. By keeping the prices constant, Real GDP removes the effect of inflation and shows us only the change in the actual quantity of goods and services produced.
Real GDP is the true measure of a country’s economic growth.
- Example:
- In 2020 (base year), India makes 10 cars at ₹5 lakh each. GDP = ₹50 lakh.
- In 2025, India makes 11 cars, but the price is now ₹6 lakh each.
- Nominal GDP for 2025 = 11 cars × ₹6 lakh = ₹66 lakh.
- Real GDP for 2025 (using 2020 prices) = 11 cars × ₹5 lakh = ₹55 lakh.
- The real economy grew from ₹50 lakh to ₹55 lakh. The rest of the increase in the Nominal GDP was just due to price rise (inflation).
GDP Deflator: This is a tool to measure the overall inflation in the economy.
- Formula: GDP Deflator = (Nominal GDP / Real GDP) × 100
6.4 Methods of Calculation in India
There are three ways to calculate a country’s national income. In theory, all three should give the same result.
- Production (Value Added) Method: Here, we add up the Gross Value Added (GVA) from all three sectors of the economy:
- Primary Sector (Agriculture)
- Secondary Sector (Industry/Manufacturing)
- Tertiary Sector (Services)
- (GVA is the value of the final product minus the cost of inputs used to make it).
- Income Method: Here, we add up all the incomes earned by people in the country. This includes:
- Wages and salaries of employees.
- Rent, interest, and profits earned by owners of capital.
- Mixed income of self-employed people (like doctors, shopkeepers).
- Expenditure Method: Here, we add up all the spending done in the economy on final goods and services. The formula is:
- GDP = C + I + G + (X – M)
- C = Private Consumption (spending by households like us).
- I = Investment (spending by businesses on new factories, machines).
- G = Government Spending (on roads, salaries, defence).
- (X – M) = Net Exports (Value of Exports minus Value of Imports).
6.5 Recent Changes in India’s GDP Calculation (Post-2015)
This is a very important topic for the UPSC exam. In 2015, the way India calculates its GDP was changed significantly.
What were the key changes?
- New Base Year: The base year for calculating Real GDP was updated from 2004-05 to 2011-12. This is done periodically to make sure the GDP calculation reflects the modern economy.
- Shift to Market Price: The main GDP figure is now reported at Market Prices, not Factor Cost. This is the international standard.
- Use of GVA: For sector-wise breakdown, the term Gross Value Added (GVA) at basic prices is now used.
- Bigger Data Source (MCA-21): This was the biggest change. Earlier, the data was taken from a survey of about 2 lakh companies. Now, the government uses the official financial data filed by over 5 lakh companies with the Ministry of Corporate Affairs (this database is called MCA-21). This gives a much wider and more formal view of the corporate sector.
- Better Coverage: Data from other sectors like finance and local governments was also improved.
The Debate and Challenges After the Change
These changes were made to improve the quality of data and follow global standards. However, they also led to a big debate.
- It became difficult to compare the economic growth before and after 2015.
- For a few years after the change, the new GDP numbers showed strong growth, but other indicators like factory production and job creation were weak. This made many economists question the reliability of the new numbers.
- “Discrepancies”: In the final data, there is often a difference between the GDP calculated by the production method and the expenditure method. This difference is called a “discrepancy.” A large discrepancy suggests that there are problems in collecting data, especially from India’s huge informal sector (small shops, daily wage labourers etc.), which is very hard to measure accurately. This is a major challenge for Indian policymakers.
Section 7: Inflation and Price Stability
Inflation is one of the most important macroeconomic topics. It directly impacts the life of a common person (our well-being), the profits of businesses, and the health of the entire economy. For any government in India, controlling inflation is a top priority.
7.1 Understanding Inflation
What is Inflation? 🤔
In the simplest words, inflation is the rate at which the prices of most goods and services are increasing over time. It is also known as mehengai.
This means that the purchasing power of your money goes down. The ₹100 note in your pocket can buy fewer things today than it could last year.
Important points to remember:
- The price rise must be sustained, meaning it should continue for a period of time. A sudden one-day jump in the price of tomatoes is not inflation.
- The price rise must be general, meaning the prices of most things in the economy (food, clothes, fuel, services) are rising, not just one or two items.
The opposite of inflation is deflation, which is when the prices of most things are continuously falling.
7.2 Types and Causes of Inflation
Inflation can happen for different reasons. Let’s look at the main causes.
- Demand-Pull Inflation
This is the most common type. The classic way to describe it is: “Too much money chasing too few goods.”
This happens when the total demand for goods in the country is much higher than the total supply. Everyone wants to buy things, but there aren’t enough things to go around. This excess demand “pulls” the prices up.
- What causes this high demand?
- More money in the economy: If the RBI prints a lot of money, or if banks give out a lot of cheap loans, people have more money to spend.
- Government spending: If the government spends a lot on new projects or cuts taxes, people are left with more money in their hands.
- Rising Incomes: If people get good salary hikes and feel confident about the future, they tend to spend more.
- Black Money: A lot of hidden, untaxed money can also create extra demand.
- Cost-Push Inflation
This type of inflation comes from the producer’s side. It happens when the cost of making a product goes up. To protect their profits, companies are forced to increase the selling price of the final product. The rising cost is “pushing” the price up.
- What causes these costs to go up?
- Rise in Raw Material Prices: A big jump in the global price of crude oil is a classic example. When oil becomes expensive, petrol and diesel prices go up. This increases the transportation cost for everything, from vegetables to cars, making them all more expensive.
- Higher Wages: If companies have to pay higher salaries to their workers without the workers becoming more productive, their costs increase.
- Infrastructure Problems: Bad roads, crowded ports, or lack of warehouses can increase the cost of transportation and logistics for businesses.
- Higher Taxes: If the government increases indirect taxes like GST, the final price of the product for the consumer goes up.
- Structural Inflation
This is a special kind of inflation that is very common in developing countries like India. It is caused by long-term weaknesses or “structural problems” in the economy, especially in the agriculture sector.
Think of it like trying to fill a bucket that has holes. No matter how much water you pour, the structural problems (the holes) cause wastage and problems.
- What are these structural problems in India?
- Inefficient Supply Chains: A large portion of fruits and vegetables get wasted before they can even reach the market from the farms.
- Lack of Storage: We don’t have enough cold storage facilities, so when there is a bumper crop of onions or potatoes, we can’t store them properly, leading to shortages later.
- Market Imperfections: Sometimes, big traders hoard essential goods (like pulses) to create an artificial shortage and then sell them at a very high price. This is illegal.
7.3 How We Measure Inflation in India
We can’t track the price of every single item. So, we measure inflation using a price index.
A price index is simple. The government creates a “shopping basket” of goods and services that a typical family consumes. Then, it tracks the total cost of this basket every month. The percentage change in the cost of this basket is the inflation rate.
In India, we use two main price indices:
- Wholesale Price Index (WPI)
- What it measures: It tracks the prices of goods at the wholesale level. This is the price at which factories sell to wholesalers, or wholesalers sell to retailers (in bulk). It measures inflation from the producer’s point of view.
- Who publishes it: Office of the Economic Adviser, Ministry of Commerce and Industry.
- What’s in its basket:
- Only Goods, no services.
- The highest weightage is given to Manufactured Products (like steel, chemicals, textiles), which make up about 64% of the basket.
- Limitations:
- It does not include services like education, healthcare, or transport, which are a big part of our expenses.
- It does not show the price that we, the final consumers, actually pay in the shops.
- Consumer Price Index (CPI)
- What it measures: This tracks the prices of goods and services at the retail level. This is the price that you and I, the consumers, pay. It is the best measure of the cost of living.
- Who publishes it: The main CPI data is released by the National Statistical Office (NSO).
- What’s in its basket:
- It includes both Goods and Services.
- A very important difference from WPI: The highest weightage is given to Food and Beverages, which makes up about 45% of the basket. This is because an average Indian family spends a large part of its income on food.
- Policy Relevance (Very Important!): The CPI is the main inflation measure used by the Reserve Bank of India (RBI) to make its policy decisions. When the RBI decides to increase or decrease interest rates, it is looking at the CPI number. The government has given the RBI a target to keep CPI inflation around 4%.
Table 2: WPI vs. CPI – A Detailed Comparison for UPSC
| Parameter | Wholesale Price Index (WPI) | Consumer Price Index (CPI – Combined) |
| Stage of Transaction | Wholesale level (Producer/Trader) | Retail level (Final Consumer) |
| Publishing Agency | Office of Economic Adviser (Ministry of Commerce) | National Statistical Office (NSO) |
| Base Year | 2011-12 | 2012 |
| Goods/Services Covered | Goods only | Both Goods and Services |
| Major Component (Highest Weightage) | Manufactured Products (~64%) | Food and Beverages (~45%) |
| Use in Policy Making | Used as a key indicator of producer-side inflation | Official target for RBI’s Monetary Policy |
| Reflection of Consumer Burden | Indirectly reflects costs passed on to consumers | Directly measures the cost of living for households |
7.4 How India Fights Inflation: The Policy and the Plan
The way India tries to control inflation has changed a lot in recent years. It has become much more modern and systematic.
- The Big Shift: From WPI to CPI Targeting 🎯
- The Old Way: For many years, the RBI used the WPI (Wholesale Price Index) as its main guide to check inflation. The problem was, as we discussed, WPI measures prices at the wholesale level and doesn’t include services. It was not an accurate measure of the actual cost of living for a common person.
- The Change: A committee headed by the former RBI Governor, Dr. Urjit Patel, recommended that the RBI should stop using WPI and start using CPI (Consumer Price Index).
- The New Way: In 2014, the RBI officially adopted this recommendation. The CPI became the new main measure of inflation for all its policy decisions. This was a major step because CPI accurately reflects the prices that you and I, the consumers, actually pay.
- The New System: Flexible Inflation Targeting (FIT) and the MPC
In 2016, the system was made even better by making a change in the RBI Act (the law that governs the RBI). This created a modern framework for fighting inflation.
- The Monetary Policy Committee (MPC) was created:
- This is a powerful six-member committee. Three members are from the RBI (including the Governor), and three members are appointed by the government.
- The main job of the MPC is to decide the policy repo rate. The repo rate is the interest rate at which the RBI lends money to other banks. This is the most powerful tool to control the money supply and inflation in the economy.
- A New Strategy called Flexible Inflation Targeting (FIT) was introduced:
- This means the government and the RBI have officially set a specific target for inflation.
- The Target: The target for CPI inflation is 4%.
- The “Flexible” Part: The target is not rigid. There is a “tolerance band” or a safe range of +/- 2 percent.
- This means the RBI’s official, legal mandate is to keep the CPI inflation within the range of 2 percent to 6 percent.
Think of it like setting the thermostat of an air conditioner. You set the ideal temperature to 24 degrees (the 4% target), but you are comfortable as long as it stays between 22 and 26 degrees (the 2% to 6% band). The MPC’s job is to keep the economy’s “temperature” within this comfortable band.
Why was this change so important for India?
This new system completely changed the way the RBI works. It was a fundamental shift in its philosophy.
- Before (The Old Way): The RBI had many goals to juggle at the same time. It had to control inflation, but also push for economic growth, and also keep the rupee stable. There was no clear number one priority. It was a difficult balancing act.
- Now (The New Way): The RBI has one primary, legally-mandated goal: Price Stability (which means keeping inflation within the target). All other goals, like growth, are now secondary to this main goal. This has made the RBI’s job much clearer and more focused.
Benefits of the New System:
- More Credibility and Accountability: The RBI is now more trustworthy and accountable. Everyone knows exactly what its main job is, and we can judge its performance based on a clear number.
- Clear Performance Report Card: We can easily see if the MPC is doing its job. Is inflation between 2% and 6%? If yes, they are succeeding. If it goes above 6% or below 2%, they are failing.
- Punishment for Failure: There is a clear rule. If inflation stays outside the 2% to 6% band for three consecutive quarters (which is 9 months), the RBI is legally required to write a report to the government. In this report, it must explain:
- Why it failed to meet the target.
- What steps it will take to bring inflation back into the target range.
- Controls People’s Expectations: Because the system is so transparent and rule-based, it helps control what people and businesses expect about future inflation. When people believe that the RBI is serious about controlling prices, they act accordingly, which itself helps to keep inflation low.
Section 8: Employment and Unemployment
The job situation in a country is like its health report. If many people have jobs, the economy is healthy. If many are unemployed, the economy is sick. For a huge country like India, creating jobs and solving the problem of unemployment (having no job) and underemployment (having a job but not getting enough work or pay) is a top priority for the government.
8.1 Key Numbers to Measure the Job Market
To understand the employment situation, we use a few key indicators. The data for these mostly comes from a big government survey called the Periodic Labour Force Survey (PLFS).
- Labour Force: This is the total number of people who are available to work. It includes two groups of people:
- Employed: People who are currently working.
- Unemployed: People who are not working but are actively searching for a job or are available to work.
-
- Who is NOT in the Labour Force? People who are neither working nor looking for work are considered out of the labour force. This includes students, full-time homemakers, and retired pensioners.
- Labour Force Participation Rate (LFPR): This tells us what percentage of the total working-age population is part of the labour force. A high LFPR is good; it means more people are actively working or wanting to work.
- Worker Population Ratio (WPR): This tells us what percentage of the total working-age population actually has a job.
- Unemployment Rate (UR): This is the most famous number. It tells us the percentage of people in the labour force who do not have a job.
- Formula: Unemployment Rate = (Total Number of Unemployed People / Total Labour Force) × 100
- Important: It’s a percentage of the labour force, not the total population.
8.2 Types of Unemployment in India
Unemployment in India is a complex problem. Here are the different types you will find:
- Structural Unemployment: This is India’s biggest and most serious type of unemployment. It’s a skills mismatch. There are jobs available, and there are people looking for jobs, but the skills of the people don’t match the skills required for the jobs.
- Example: An IT company in Bengaluru needs 100 software engineers with AI skills, but the people applying for the job have only a basic BA degree. This is a long-term problem caused by issues in our education and training systems.
- Disguised Unemployment: This means “hidden” unemployment. It happens when more people are working on a job than are actually needed.
- Example: A small family farm can be managed by 2 people. But in the family, there are 5 members, and all of them work on that same farm. The extra 3 people are not adding anything to the total production. If they leave the farm, the output will remain the same. These 3 people are in disguised unemployment. This is very common in Indian agriculture.
- Seasonal Unemployment: This happens when people get work only during certain seasons of the year.
- Example: A farm labourer gets a lot of work during the sowing and harvesting seasons but may be unemployed for the rest of the year. Similarly, an ice cream seller has good business in summer but very little in winter.
- Frictional Unemployment: This is temporary, “in-between jobs” unemployment. It happens when a person leaves their old job and is in the process of joining a new one. This is a normal part of any healthy economy and is not a major concern.
- Cyclical Unemployment: This is caused by the ups and downs of the economy (the business cycle). When the whole economy goes into a recession (a slowdown), companies reduce production and fire workers. This is a bigger problem in developed countries.
- Technological Unemployment: This is when people lose their jobs because of new technology like automation, robots, or Artificial Intelligence (AI).
- Example: The job of a bank cashier being replaced by an ATM or cash deposit machine.
8.3 How Unemployment is Measured in India
Measuring unemployment in India is very difficult. This is because a large part of our economy is the informal sector, where jobs are often temporary and not officially recorded. A daily wage labourer might have work for three days, be unemployed for four days, and it’s hard to classify them.
To handle this complexity, the National Statistical Office (NSO) uses three different methods, which are like three different lenses to look at the same problem. They differ based on the reference period (the time period they look at).
The Three Methods:
- Usual Status (US): This method looks at a long reference period of the last 365 days. It is used to measure long-term or chronic unemployment. It asks, “What was your main employment status over the last year?”
- Current Weekly Status (CWS): This method looks at a short reference period of the last 7 days. A person is considered employed if they worked for even one hour on at least one day during that week. This is better for measuring short-term unemployment.
- Current Daily Status (CDS): This is the most detailed and sensitive measure. It looks at each day of the last 7 days. It measures work in “person-days.” If a person worked for only half a day, they are counted as 0.5 person-days employed and 0.5 person-days unemployed. The CDS is the best measure to capture underemployment—the problem of not having enough work.
The Periodic Labour Force Survey (PLFS)
To get more regular and timely data, the government started the PLFS in 2017. Before this, such detailed surveys were done only once every five years. The PLFS provides job data every quarter for urban areas and every year for the whole country.
Why are there different numbers? The UPSC Mains Angle.
This is the most important part for your analysis. The unemployment rate calculated by these three methods is always different.
- The rate as per Usual Status is the lowest.
- The rate as per CWS is in the middle.
- The rate as per CDS is the highest.
What does this tell us? It tells a very important story about the Indian job market. While the long-term unemployment rate (Usual Status) might look low, the much higher CDS rate reveals the true and biggest challenge for India: underemployment and poor-quality, unstable jobs.
- Example: A casual construction worker gets work for only 3 days in a week.
- According to the CWS method, he is considered “employed” because he worked for at least one hour in the week. The data would show him as employed.
- However, the CDS method would accurately show that he was unemployed for 4 out of the 7 days of the week. This gives a much more realistic picture of his hardship.
Key takeaway for your UPSC answer: A simple answer will just state the low Usual Status unemployment rate. A nuanced, high-scoring answer will highlight the difference between the three rates. It will argue that India’s main policy focus should not just be on creating any job, but on creating good quality, stable, and full-time jobs to solve the deep problem of underemployment, which is best captured by the CDS measure.
Part III: Development, Welfare, and the Economy’s Ups and Downs
Section 9: Poverty and Inequality
Poverty (garibi) and inequality (asamanata) are two of the biggest challenges in India’s development story.
It’s important to know that just because the economy is growing (our national income or GDP is increasing), it doesn’t automatically mean poverty will disappear. Economic growth is necessary, but it’s not enough. How that growth happens and who gets the benefits are just as important.
Think of it like this: Baking a bigger cake (economic growth) is good. But if only a few people get all the big slices while many get tiny crumbs, then the problem of hunger (poverty) and unfairness (inequality) remains.
9.1 How We Define and Measure Poverty: The Poverty Line
What is Poverty? Poverty is a situation where a person or a family doesn’t have enough money or essential resources to live a basic, minimum standard of life.
The Poverty Line To measure poverty, India has traditionally used the concept of a “poverty line.”
- Think of it as a minimum “passing mark.” It’s an imaginary line that sets a threshold for monthly spending (consumption expenditure).
- If a person’s monthly spending is below this line, they are classified as Below the Poverty Line (BPL).
How the Idea of the Poverty Line Changed Over Time
- The Old Way (based on calories): In the beginning, the poverty line was very basic. It was calculated based on the minimum calories a person needs just to survive (e.g., 2400 calories per day in villages and 2100 in cities, as suggested by the Alagh Committee in 1979).
- The Problem with the Old Way: This approach was heavily criticised. It was seen as just a “starvation line”. It only cared about food and completely ignored other essential things a person needs for a decent life, like clothing, a house, healthcare, and education.
9.2 Estimating Poverty in India: The Main Committees
The method to calculate the poverty line has been updated over the years by different expert committees. For the UPSC exam, two committees are very important: Tendulkar and Rangarajan.
- Tendulkar Committee (2009)
This committee changed the way we looked at poverty in a big way.
- What they did differently (Methodology):
- They moved away from the old calorie-only method.
- They created a “Poverty Line Basket” of goods and services. This basket included not just food, but also what people were actually spending on health and education. This made the poverty line much more realistic.
- What was the Poverty Line? (for 2011-12):
- For rural areas: ₹816 per person per month (which is about ₹27 per day).
- For urban areas: ₹1,000 per person per month (which is about ₹33 per day).
- How many people were poor? (Poverty Estimate):
- Based on this line, the committee estimated that 21.9% of India’s population was below the poverty line in 2011-12.
- Status (Very Important!): The Tendulkar Committee’s estimates are the last officially accepted poverty figures for India.
- Rangarajan Committee (2014)
This committee was set up to review the Tendulkar methodology.
- What they did differently (Methodology):
- They suggested a higher and more generous poverty line.
- They went back to creating separate consumption baskets for rural and urban areas.
- Their food basket was based on ideal norms for calories, proteins, and fats. They also included higher amounts for essential non-food items like clothing and rent.
- What was the Poverty Line? (for 2011-12):
- For rural areas: ₹972 per person per month (about ₹32 per day).
- For urban areas: ₹1,407 per person per month (about ₹47 per day).
- How many people were poor? (Poverty Estimate):
- Because their poverty line was higher, they estimated that a much larger portion of the population, 29.5%, was poor in 2011-12.
- Status (Very Important!): The government did not officially adopt or accept the recommendations of the Rangarajan Committee.
What is the situation now? (Contemporary Context)
This is a major challenge and a hot topic for discussion.
- We do not have any official poverty estimates after 2011-12. This is a big “data vacuum.”
- Because of this, other ways of measuring poverty have become more important:
- The World Bank’s International Poverty Line: The World Bank uses a global standard (like an income of less than $2.15 per day) to compare poverty across different countries.
- NITI Aayog’s Multidimensional Poverty Index (MPI): This is the new, modern approach that India is now focusing on. It’s “multidimensional” because it looks beyond just money. It measures poverty based on deprivations in three key dimensions:
- Health (e.g., nutrition, child mortality).
- Education (e.g., years of schooling).
- Standard of Living (e.g., access to clean cooking fuel, sanitation, drinking water, electricity). This gives a much more complete and useful picture of poverty.
Table 3: Tendulkar vs. Rangarajan Committee – A Methodological Comparison
| Parameter | Tendulkar Committee (2009) | Rangarajan Committee (2014) |
| Consumption Basket | Uniform All-India Urban basket used as reference for both rural and urban areas. | Separate consumption baskets for rural and urban areas. |
| Basis for Food Expenditure | Based on observed consumption patterns. | Based on normative satisfaction of calorie, protein, and fat requirements. |
| Inclusion of Non-Food Items | Included observed private expenditure on health and education. | Included higher normative expenditure on essential non-food items. |
| Poverty Line (2011-12) | Rural: ₹816/month; Urban: ₹1,000/month | Rural: ₹972/month; Urban: ₹1,407/month |
| National Poverty Ratio (2011-12) | 21.9% | 29.5% |
| Official Acceptance Status | Accepted by the then Planning Commission. | Not officially adopted by the government. |
9.3 How We Measure Inequality
First, let’s be clear about the difference between poverty and inequality.
- Poverty is about people not having enough money to live a basic life.
- Inequality is about the gap between the rich and the poor. It measures how the country’s total income is shared among its people.
A country can have very few poor people, but still have very high inequality if a few super-rich people have most of the money, while the rest of the population has just enough to get by.
To measure this gap, we use two main tools:
- The Lorenz Curve
This is a graph (a picture) that shows us the level of inequality.
- Imagine a square box. We draw a straight, diagonal line from the bottom-left corner to the top-right corner. This line is called the Line of Perfect Equality. It represents a perfectly equal world where the bottom 10% of people have 10% of the total income, the bottom 50% of people have 50% of the income, and so on.
- Then, we plot the actual data for a country. This creates a curved line below the straight line. This curved line is the Lorenz Curve.
- The main idea is simple: The bigger the gap between the straight line (perfect equality) and the curved line (the reality), the more inequality there is in the country. If the curve is very far away and bowed down, it means inequality is very high.
- The Gini Coefficient
The Gini Coefficient is a number or a score that is calculated from the Lorenz Curve. It gives us a single, easy-to-understand measure of inequality.
- This score ranges from 0 to 1 (or 0 to 100).
- What the score means:
- A score of 0 means Perfect Equality (everyone has the exact same income).
- A score of 1 means Perfect Inequality (one single person has all the income in the country, and everyone else has zero).
- So, a lower Gini score is better because it means the country is more equal.
- For India: The text mentions that according to recent World Bank data, India’s Gini index (based on how much people spend) has come down from 28.8 in 2011 to 25.5 in 2022. This is good news, as it suggests that the inequality in consumption has reduced.
The Big Picture: How India’s Thinking on Poverty Has Evolved
This final part summarises the journey of how we measure poverty in India. It shows a big and important shift in our thinking.
The Journey:
- Start (The Old Way): We started with a very basic and narrow method of measuring poverty based only on minimum calories. This was like checking if a person is starving or not.
- Middle (The Better Way): The Tendulkar and Rangarajan committees made the measurement better. They created a more realistic “consumption basket” that included spending on essentials like health and education, not just food.
- Now (The Modern Way): This journey of improvement has now reached its latest stage with the Multidimensional Poverty Index (MPI), which is used by NITI Aayog.
Why is the MPI the best method so far?
- It moves beyond just money. It understands that being poor is not just about having less money, but also about being deprived of basic facilities.
- It directly measures the problems people face in key areas of life. The MPI is like a doctor’s check-up that looks at 10 specific indicators across three main dimensions:
- Health (e.g., is anyone in the family malnourished?)
- Education (e.g., have children completed a few years of school?)
- Standard of Living (e.g., do they have clean drinking water, electricity, a proper toilet, and clean cooking fuel?)
- How it helps the government: This detailed report card gives policymakers a much clearer (granular) picture of poverty. It can tell them exactly what the problem is in a particular district. For example, it might show that in one area, people have enough food, but no access to clean water.
- This allows the government to make targeted policies to solve that specific problem (e.g., start a clean water project in that area) instead of just giving out cash. This approach is in line with the global Sustainable Development Goals (SDGs).
Of course! This is a very important topic for the UPSC exam because it helps us understand what “progress” really means for a country. Let’s break down the difference between Economic Growth and Economic Development in very simple Indian English.
Section 10: Economic Growth vs. Economic Development
In everyday conversations, we often use the words “growth” and “development” to mean the same thing. But in economics, they are two very different concepts. Understanding this difference is key to judging a country’s real progress.
10.1 The Big Difference
Economic Growth 🌱
- This is a purely quantitative concept. It’s all about numbers and how much bigger the economy has become.
- It’s unidimensional, meaning it only looks at one thing: the increase in the country’s income.
- Definition: Economic growth simply means the increase in the total value of goods and services (the real output) a country produces over time.
- How we measure it: We measure it by the percentage increase in Real GDP or Real GDP per capita.
- Simple Analogy: Economic growth is like a child getting taller and heavier. It’s just a physical increase in size.
- Important Point: Growth is necessary for development, but it’s not enough on its own. A bigger economy doesn’t automatically mean a better life for everyone.
Economic Development 🌳
- This is a qualitative concept. It’s about the quality of life for the people.
- It’s multidimensional, meaning it looks at many different aspects of life, not just money.
- Definition: Economic development is a much broader idea. It includes economic growth, but it also includes improvements in the overall well-being of the population.
- What it includes:
- Reducing poverty.
- Better healthcare and education for everyone.
- More equality and less of a gap between the rich and the poor.
- More freedom and opportunities for citizens to live the life they want.
- Simple Analogy: Economic development is like the child not just getting taller, but also becoming smarter, healthier, happier, and more mature. It’s an all-round improvement.
10.2 Measuring Development: The Human Development Index (HDI)
Since GDP only tells us about the size of the economy (growth) and not about people’s well-being (development), we needed a better tool. So, the United Nations Development Programme (UNDP) created the Human Development Index (HDI) in 1990.
The main idea of the HDI is that a country’s progress should be measured by the quality of life of its people, not just by its bank balance.
What are the components of the HDI?
The HDI combines three basic dimensions of human life to give a single score:
- A Long and Healthy Life ❤️
- This is measured by Life Expectancy at Birth. (How many years is a newborn baby in that country expected to live?)
- Access to Knowledge 📚
- This is measured by two indicators of education:
- Mean Years of Schooling: On average, how many years of education have the adults in the country completed?
- Expected Years of Schooling: How many years of education can a child who is starting school today expect to receive in their lifetime?
- This is measured by two indicators of education:
- A Decent Standard of Living 💰
- This is measured by the Gross National Income (GNI) per capita. (This is a way of measuring the average income of each person in the country).
Each of these three parts is given equal importance. The final HDI score for a country is a number between 0 and 1. The closer the score is to 1, the higher the level of human development.
10.3 How India Performs on the HDI
According to the latest UNDP report (for the year 2022):
- India’s HDI Value and Rank: India’s score is 0.644, which puts us in the “Medium human development” category. Our rank is 134 out of 193 countries.
- Progress over Time: India has made a lot of progress. Our HDI score has improved significantly since 1990. Our life expectancy and average income have also increased a lot.
- Inequality between States: There is a huge difference in development within India.
- States like Kerala and Goa have high HDI scores, similar to some developed countries.
- States like Bihar and Jharkhand are far behind the national average. This shows deep regional inequality.
10.4 Other Important Development Indices
The UNDP also gives some other indices to get a more detailed picture:
- Inequality-adjusted HDI (IHDI): The normal HDI is just an average. The IHDI takes the HDI score and reduces it to show the negative impact of inequality. The gap between the HDI and IHDI is the “loss” in development due to inequality. For India, this loss is very high at 31.1%, which means we have a big problem with inequality.
- Gender Development Index (GDI): This compares the HDI of women with the HDI of men. A score closer to 1 means more gender equality.
- Gender Inequality Index (GII): This measures the loss in development due to inequality between men and women in three areas: health, empowerment (e.g., women in parliament), and work.
The Big Paradox: India’s “Growth-Development Disconnect”
This is the most important analytical point for your UPSC exam.
- The Paradox: On one hand, India is one of the world’s largest economies in terms of total GDP (we are ranked 4th or 5th). We have achieved high economic growth.
- But on the other hand, our rank in the Human Development Index is a very modest 134. Our economic development is low.
This big gap is called the “Growth-Development Disconnect.”
What does it mean? It means that the benefits of India’s fast economic growth have not been shared equally and have not translated into a better quality of life (better health, better education, etc.) for the average Indian citizen.
The fact that our IHDI shows a huge loss due to inequality confirms this. This disconnect is a fundamental challenge for India and a very important topic to analyse in your Mains answers, especially when you write about the need for inclusive and sustainable development.
Of course! The business cycle sounds complicated, but it’s a very simple idea about the ups and downs of an economy. Let’s break it down in easy-to-understand language for your UPSC preparation.
Section 11: The Business Cycle
An economy never grows in a perfectly straight line. It’s more like a wave. There are good times when the economy grows very fast, and these are followed by bad times when the economy slows down or even shrinks.
This repeating, but irregular, up-and-down pattern in a country’s economic activity is called the Business Cycle. We usually track these ups and downs by looking at the changes in the Real GDP.
11.1 Understanding These Ups and Downs
The business cycle is simply the alternating period of expansion (good times) and contraction (bad times) in an economy.
These cycles are a normal and natural part of any market-based economy, like India’s. They can last for a few years or even up to a decade. Understanding this cycle is very important for businesses, investors, and the government to make smart decisions.
11.2 The Four Phases of the Business Cycle
A typical business cycle has four distinct phases. Think of it like a roller coaster ride.
- Expansion (Boom or Good Times) 📈
This is the phase where the roller coaster is going up. The economy is growing, and things are generally good.
- What happens during an expansion?
- Factories are producing more goods.
- More people are getting jobs, and the unemployment rate is falling.
- People feel confident, so they spend more money. Businesses also invest more in new factories and machines.
- Companies are making good profits, and the stock market is rising.
- A word of caution: If the expansion goes on for too long and gets too fast, the economy can start to “overheat,” and prices can start rising quickly (inflation).
- Peak 🏔️
This is the highest point of the roller coaster ride.
- The economy has reached its maximum growth for that cycle.
- Economic activity is at its highest level. Production is at full capacity, and unemployment is at its lowest point.
- The peak is also the turning point. Problems like high inflation or rising interest rates start to act as brakes, slowing down the economy.
- Contraction (Recession or Bad Times) 📉
This is the phase where the roller coaster is going down. The economy starts to slow down and shrink.
- A recession is generally defined as a period when the Real GDP falls for at least two consecutive quarters (that is, for six months).
- What happens during a recession?
- The country’s Real GDP is falling.
- Businesses cut back on production and start firing workers, so the unemployment rate starts rising.
- People get worried about the future and start spending less, especially on non-essential items like cars or holidays.
- Company profits fall, and the stock market goes down (this is called a “bear market”).
- A very long and very severe recession is called a Depression.
- Trough and Recovery revitalization
- Trough: This is the lowest point of the roller coaster, where the economy hits rock bottom.
- Recovery: After the trough, things start to get better, and the economy begins to grow again. This phase is called the recovery or revival.
- What happens during a recovery?
- Real GDP starts to increase gradually.
- Companies start hiring again, so the unemployment rate slowly comes down.
- Confidence returns, and people and businesses start spending and investing again.
- The recovery continues until the economy enters a new expansion phase, and the whole cycle starts over again.
Why is this important for UPSC? (Counter-Cyclical Policy)
This is the most important part. The concept of the business cycle is the reason why the government and the RBI have to actively manage the economy. Their strategy is called counter-cyclical policy.
“Counter-cyclical” simply means “leaning against the wind”. The government and the RBI should do the opposite of what the economy is doing.
- During an Expansion (Boom): The economic wind is blowing too fast, and the economy is overheating with high inflation.
- Policy Response: The government and RBI should apply the brakes to cool it down.
- Tools (Contractionary Policy): The RBI can raise interest rates to make loans more expensive. The government can cut its own spending or increase taxes.
- During a Contraction (Recession): The economic wind has stopped, and the economy is stuck.
- Policy Response: The government and RBI should press the accelerator to get the economy moving again.
- Tools (Expansionary Policy): The RBI can cut interest rates to make loans cheaper. The government can increase its spending (e.g., on building roads) or cut taxes to put more money in people’s hands.
The Best Real-World Example: The COVID-19 Pandemic
- The pandemic and the lockdowns caused a sudden and deep contraction (recession) in the Indian economy.
- In response, the government and the RBI used classic counter-cyclical policies to fight the slowdown:
- The RBI’s Role: It immediately cut interest rates and pumped a lot of money into the banking system to keep credit flowing. (This was an expansionary monetary policy).
- The Government’s Role: It announced a massive fiscal stimulus package called Atmanirbhar Bharat to support poor households and small businesses. (This was an expansionary fiscal policy).
- These actions helped to soften the economic blow and led to what was later described as a “V-shaped” recovery.
Part IV: Today’s Indian Economy: A Guide for Aspirants
Section 12: Highlights from the Economic Survey and Union Budget
For anyone preparing for the UPSC, two government documents are like the Bible: the Economic Survey and the Union Budget.
- Economic Survey: Think of this as the economy’s annual health report card. It is presented just before the budget. It tells us how our economy performed in the past year, what its strengths are, and what challenges it faces.
- Union Budget: This is the government’s financial plan for the next year. It’s like a big household budget. It shows where the government plans to get its money from (taxes, etc.) and where it plans to spend it (on schemes, defence, salaries, etc.).
Let’s look at the key highlights for the 2025-26 period based on the text.
12.1 The State of the Economy: Growth and Future Outlook
- How we did recently: The Indian economy has shown great strength (“resilience”) even when the global situation was difficult. The Real GDP growth has been strong. For example, in the first three months (April-June) of the financial year 2025-26, it was a robust 7.8%. This growth was mainly because of two reasons:
- Strong domestic demand: People and businesses within India were spending money.
- Government spending: The government spent a lot of money on creating assets like roads and ports (capital expenditure).
- The services sector (like IT, banking, tourism) also performed very well.
- What to expect in the future: The Economic Survey predicts that the Real GDP will grow in the range of 6.3% to 6.8% in the financial year 2025-26. To achieve the big dream of becoming a developed nation (‘Viksit Bharat’) by 2047, the Survey says India needs to grow at an average rate of about 8% per year for the next 10-20 years.
- Strengths and Weaknesses:
-
- Drivers (Things that will help growth): Continued government spending, more demand from villages, and businesses feeling confident about investing.
- Challenges (Risks and problems): Tensions between countries (geopolitical tensions), uncertainty in global trade, and the need to encourage private citizens and companies to spend and invest more.
12.2 Inflation (Mehengai): Trends and Management
- Overall Inflation: The good news is that the main retail inflation (CPI) has been coming down, from 5.4% to 4.9%.
- Food Inflation: This remains a major headache. The prices of food, especially vegetables and pulses (dals), have remained high (around 8.4%). The main reasons are problems in the supply chain and bad weather affecting crops.
- What is being done?:
- The Government is taking “supply-side” measures. This means it is trying to increase the supply of food by creating extra stocks of grains (buffer stocking) and by making it easier to import food items that are in short supply.
- The RBI’s Monetary Policy Committee (MPC) is continuing its main job of trying to bring the CPI inflation down to its target of 4%.
12.3 The Government’s Finances (Fiscal Policy)
The Union Budget for 2025-26 is focused on two main goals: gradually reducing the government’s borrowing and, at the same time, spending on things that help the economy grow.
- Fiscal Deficit Target:
- What is Fiscal Deficit? It is the shortfall between the government’s total income and its total expenditure. It is the amount of money the government needs to borrow each year.
- The target for 2025-26 is to bring the fiscal deficit down to 4.4% of GDP. This is part of a long-term plan to reduce borrowing.
- Where is the money being spent?:
- The biggest priority has been Capital Expenditure (Capex). Capex is spending on creating long-term assets for the country like highways, railways, ports, and bridges. This type of spending is very good for future economic growth. The budget has allocated a record ₹11.21 lakh crore for this.
- A large part of the government’s expenditure (about 25%) also goes towards paying interest on the loans it has taken in the past.
- Where will the money come from?: The government expects its income (receipts) to grow, mainly because it expects to collect more taxes.
12.4 Big Ideas and New Schemes
- The Economic Survey’s Vision:
- The Survey notes that the world is splitting into different economic groups (“Geo-Economic Fragmentation”). Therefore, India needs to depend on its own internal strengths to grow.
- The top priority should be to make it easier to do business in India (Ease of Doing Business 2.0) and to remove unnecessary rules (deregulation).
- This will empower our small and medium-sized businesses (MSMEs), which the Survey calls India’s potential “Mittelstand” (a German word for the strong backbone of medium-sized companies).
- Major Announcements in the Union Budget 2025-26:
- For Agriculture: A new “PM Dhan-Dhaanya Krishi Yojana” and a mission to make India self-sufficient in pulses.
- For MSMEs and Manufacturing: A new scheme for first-time entrepreneurs and a “National Manufacturing Mission” to support the “Make in India” goal.
- For Infrastructure: A special 50-year interest-free loan of ₹1.5 lakh crore to state governments to encourage them to spend more on capex. Also, a plan to earn money by leasing out government assets to private companies (Asset Monetization Plan 2.0).
- For Taxpayers: A new, simpler income tax system with lower tax rates.
- For Reforms: A plan to allow private companies to partner in the nuclear energy sector, which is a major reform.
Of course! This is the final and most important section. It teaches you how to use all the concepts we’ve discussed to write excellent answers in the UPSC exam. Let’s break down this winning strategy in very simple terms.
Section 13: Conclusion – How to Connect Everything for UPSC Success
This is the final summary. We have travelled through all the basic concepts of economics, from the small decisions of one person (microeconomics) to the big picture of the entire nation (macroeconomics).
The single most important takeaway for a UPSC aspirant is to understand that all these concepts are connected to each other like a spider’s web. No economic event happens on its own; it’s always connected to something else.
13.1 The Web of Connections
Let’s see how this web works with a couple of examples.
Example 1: The Chain Reaction of Growth
Follow this chain of events step-by-step:
- The country experiences high Economic Growth. (This is from Section 10)
- This means people’s incomes are increasing.
- When people have more money, they want to buy more things. This creates a situation of “too much money chasing too few goods,” which leads to Demand-Pull Inflation. (This is from Section 7)
- To control this high inflation, the RBI’s Monetary Policy Committee (MPC) steps in. They use a counter-cyclical policy to cool down the overheating economy. (This is from Section 11 on Business Cycles)
- What do they do? They raise interest rates.
- This action might slow down investment and growth for a short time, but it’s a necessary step to ensure price stability, which is needed for healthy, sustainable development in the long run.
See how one event (growth) is connected to four other major topics we have studied?
Example 2: The Problem with the Wrong Kind of Growth
Here is another chain of connections:
- The biggest challenge for India is to reduce Poverty. (This is from Section 9)
- We know that just having Economic Growth is not enough to solve this. The type of growth is very important.
- What if the growth is happening only in big industries that use a lot of machines but very few people (these are called capital-intensive sectors)?
- Such growth will not create enough jobs. This leads to the serious problem of “jobless growth” and increases Structural Unemployment. (This is from Section 8)
- This shows us that our goal should not just be growth, but real Economic Development, which is inclusive (benefits everyone) and improves people’s lives (health, education). (This is from Section 10)
The final goal of all government schemes and the Union Budget is to use growth as an engine to achieve these bigger goals of development, fairness (equity), and welfare for all citizens.
13.2 How to Use This in the Mains Exam
To get high marks in the UPSC Mains (GS Paper 3), you cannot just write basic definitions. You have to apply these concepts to analyse real-world issues. The questions are designed to check if you can connect the dots.
Example 1: A question on “Inclusive Growth”
“Inclusive growth” is a favourite topic in the Mains exam. A weak answer will just define it. A strong, high-scoring answer will connect multiple topics from the syllabus:
- National Income: You should start by discussing India’s GDP growth rate. Which sectors are growing fast?
- Employment: Then, you must analyse if this growth is creating enough good-quality jobs. Or is it a case of “jobless growth”?
- Poverty and Inequality: Are the benefits of this growth reaching the poor? Is poverty (as measured by committees) going down? Is the gap between the rich and poor (Gini coefficient) reducing?
- Economic Development: Finally, you should argue that true inclusive growth must show results in the form of a better Human Development Index (HDI) rank, not just a higher average income.
Connecting these four areas will make your answer multidimensional and impressive.
Example 2: A question on the changes in GDP calculation
- A Superficial Answer: Would just list the changes (e.g., the base year was changed to 2011-12, the MCA-21 database is now used).
- An Expert-Level Answer: Would go much deeper. It would explain:
- WHY the changes were made (to follow international standards).
- WHAT the implications were (it created a debate about the data’s reliability).
- HOW it connects to a bigger problem (the difficulty of accurately measuring India’s vast informal economy).
The Secret to a High-Scoring Answer
The key is to move beyond the “What” and explain the “Why” and the “How.”
- “What” = The basic definition of a concept. (e.g., What is fiscal deficit?)
- “Why” = The economic logic behind something. (e.g., Why has the government decided to increase capital expenditure?)
- “How” = The way a policy works and what its positive and negative effects are. (e.g., How does raising the repo rate affect inflation and growth?)
By mastering these basic concepts and practicing how to connect them to analyse current events in India, you will build the analytical depth needed to score very well in both Prelims and Mains.